


Equity risk premium (ERP) – (dis)advantages of various methods
The choice of ERP calculation can significantly affect the calculation of company's value. Which approach do we choose?

Andrej Dolenc
Financial Consulting Project Manager
12. October 2021
Equity Risk Premium (ERP) is an important part of the discount rate, with which we discount the cash flows of the assessed company. However, since there are many ways to calculate ERP, a certain level of caution upon choosing it must be taken into consideration, as the choice can significantly affect the final calculation of the value.
What exactly is Equity Risk Premium?
Each investor must decide how to allocate their money between stocks, bonds and cash. The equity risk premium shows how much an investor can earn by investing in the stock market instead of government bonds. If the equity premium is high, investors will generally allocate more of their portfolio to stocks, if low, then more will be allocated to bonds.
As it can be observed from the definition, ERP is a theoretical concept, which is very difficult to measure in practice. There are two basic dilemmas in determining ERP. Firstly, it’s not entirely clear what market return and risk-free interest rates really represent (which I discussed in a previous blog post). In practice, market returns are based on stock market indices such as the S&P 500 or the Dow Jones Industrial Average, but these indices do not include all shares traded and exclude several other potential investments, such as housing and private equity. Secondly, measurements of past equity risk premium depend on two factors - the date of commencement of the investment in shares and bonds and the length of time used to measure the yield on shares and bonds. Consequently, the calculation can be very subjective.
Even if we limit ourselves to only traded stocks, we still have a choice of how we process the data. Do we weigh them by the size the company represents in the index, or do we just average? Do we exclude stocks that are rarely traded? Do we use a geometric or arithmetic mean?
Due to all the “dilemmas” listed above, three other methodologies are also used, namely:
- Dividend discount model (the only future-oriented method)
- Use of regressions
- Use of questionnaires regarding the use of ERP in practice
Each method has its advantages and disadvantages, which I will thoroughly analyze in future posts.
In practice, when calculating the discount rate, questions regarding which source of calculated ERP to use are raised, unless we start the calculation ourselves, which is time-consuming. There are several experts or organizations that publish their ERP calculations. Most known are:
Interestingly, all four sources calculate ERP in different ways, which means that the final calculated ERPs are different.
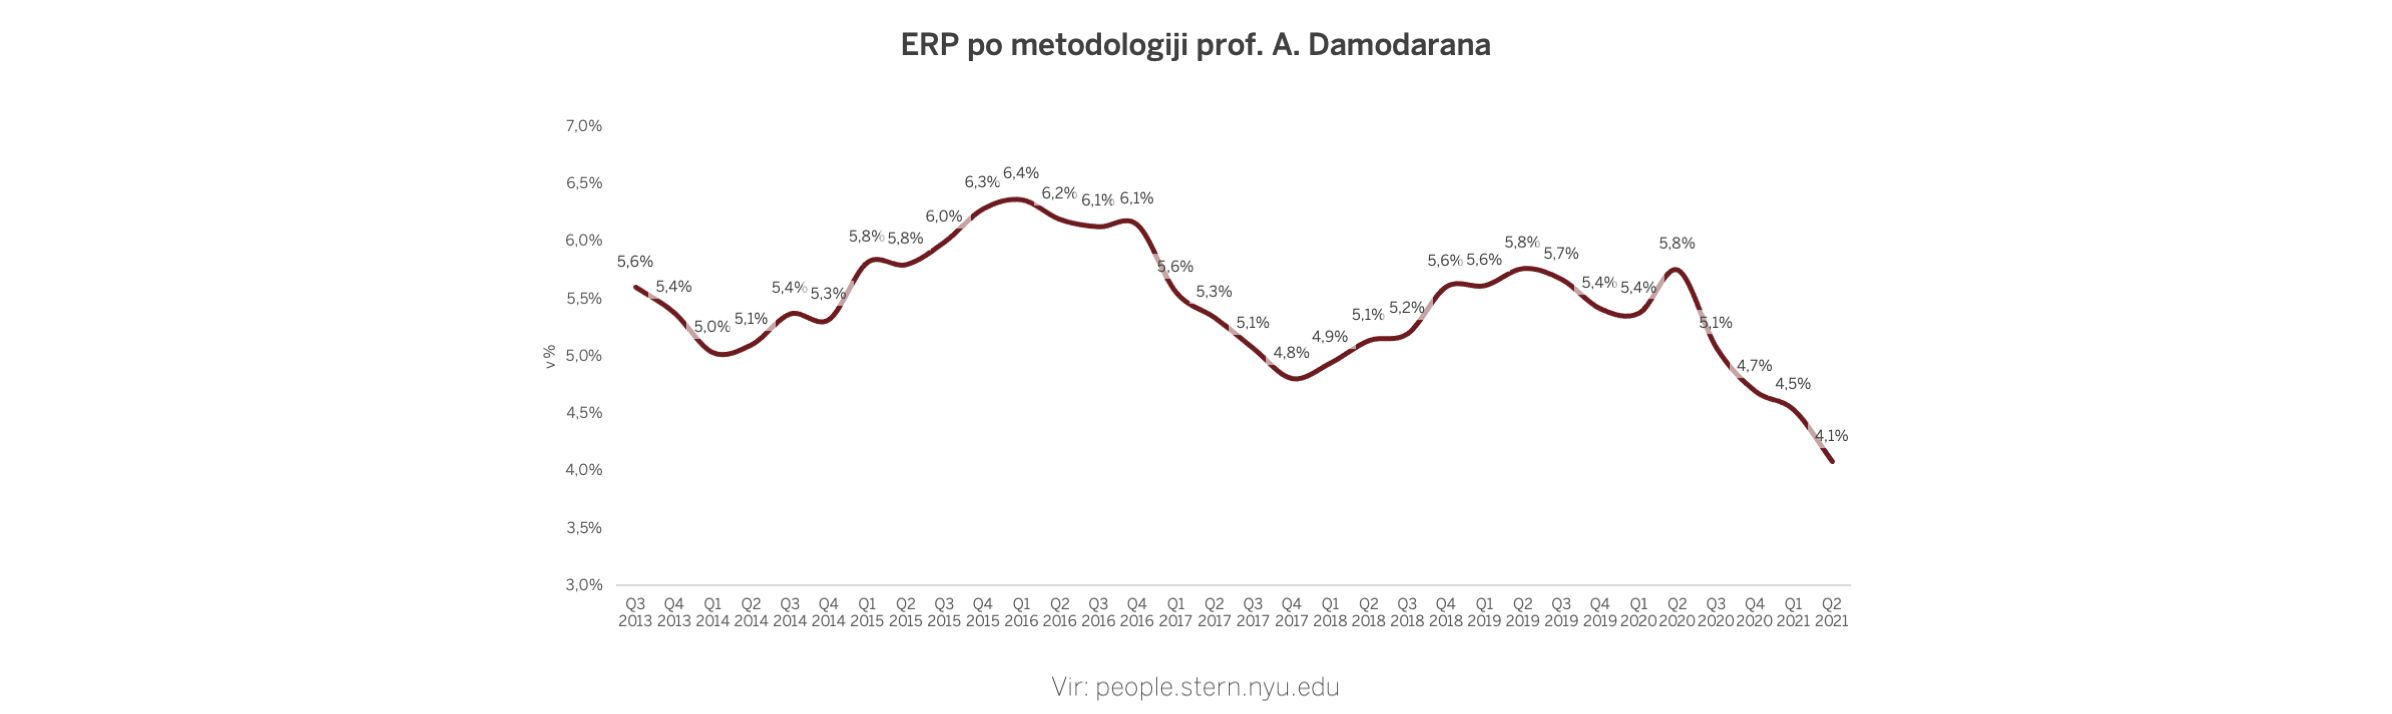
Prof. Damodaran calculates ERP based on the S&P 500 index, namely based on historical data. In Q3 2021 prof. Damodaran’s ERP is 4.1% (T12m data).
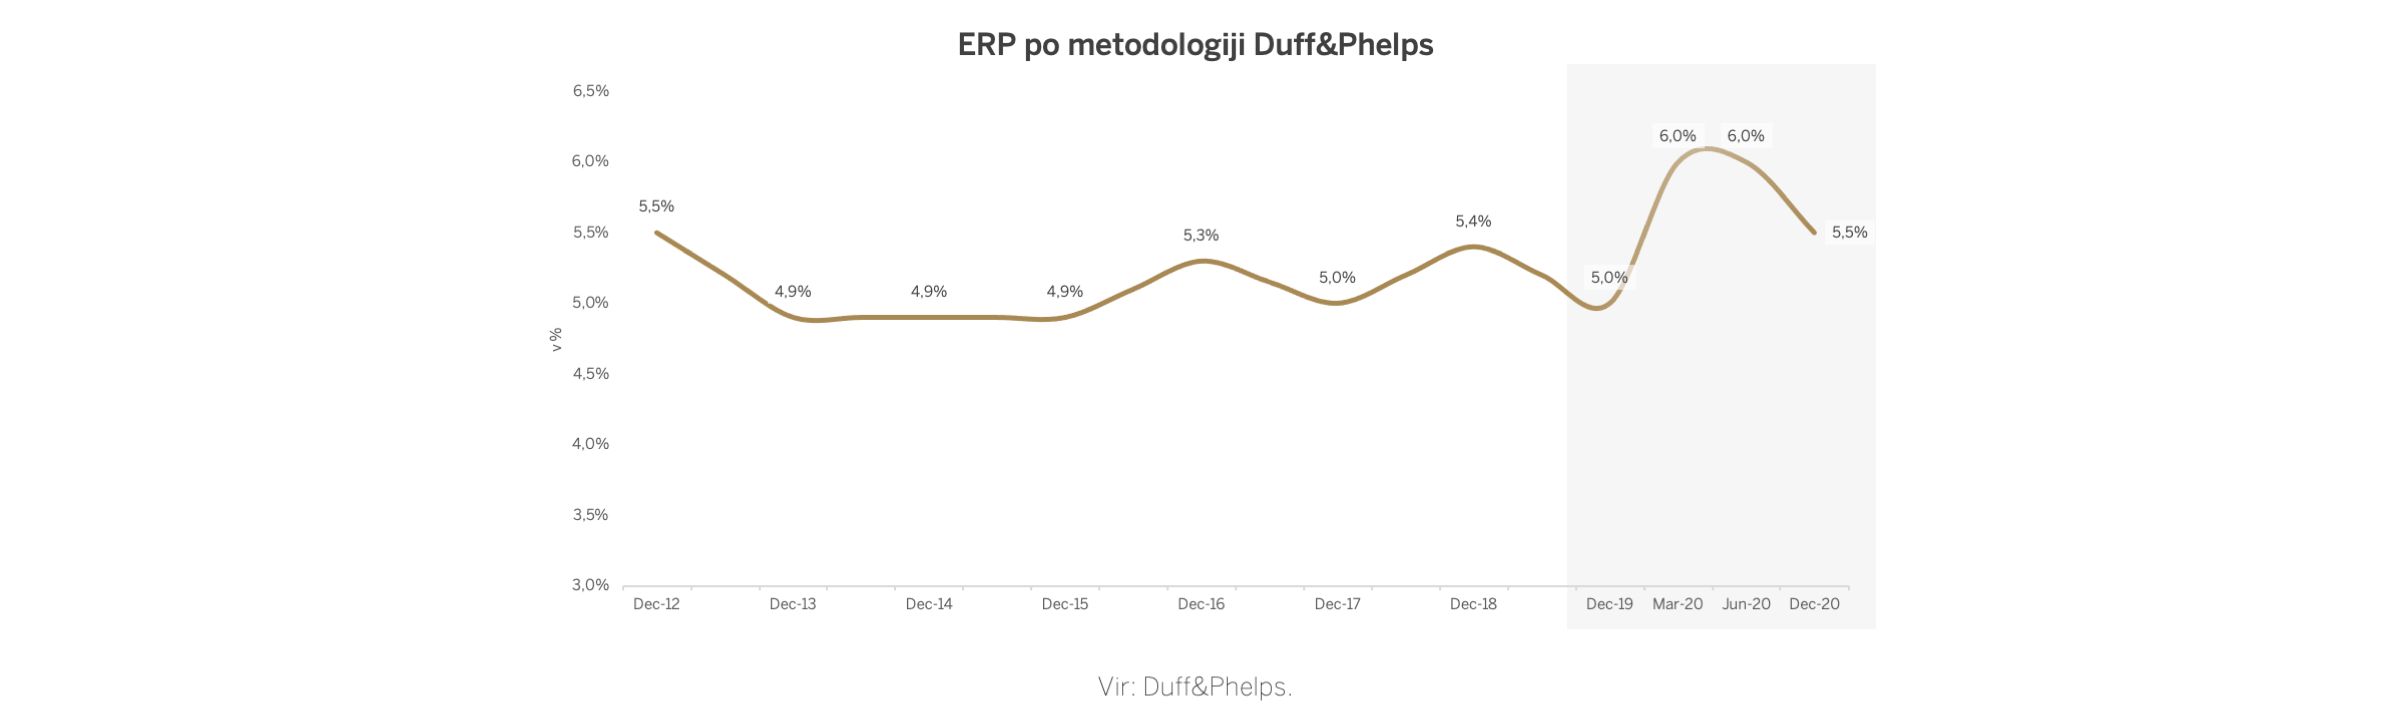
Duff & Phelps currently estimates ERP at 5.5%. Care must be taken in Duff & Phelps' calculation, as it assumes an adjusted risk-free rate of return of 2.5%. If we use Duff & Phelps calculation, it is therefore necessary to use their risk-free rate of return, and not a spot rate.
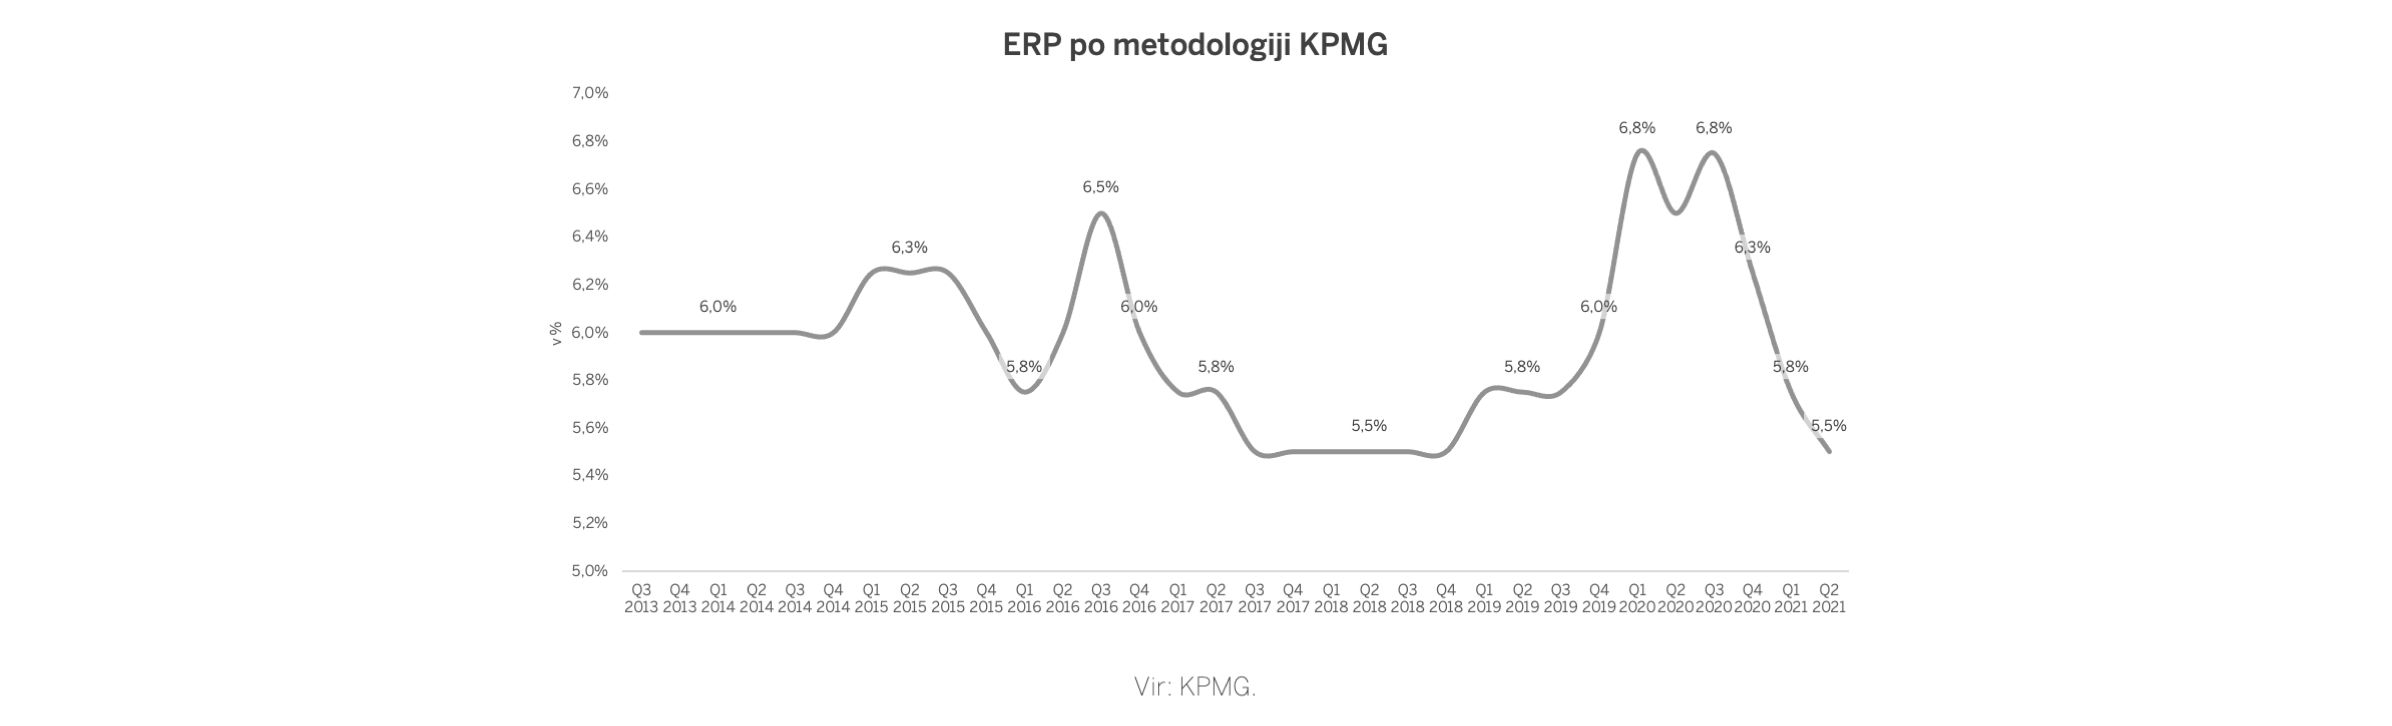
The KPMG study is interesting as the calculation is based on European indices. The trend of KPMG’s ERP is similar to that of Damodaran’s calculation. The methodology used is based on DCF. The current ERP is 5.5%.
Fernandez's study from this year shows that in Slovenia the most commonly used ERP is 6.0%. His study is based on a questionnaire of experts in the financial world. I would not base my calculations on Fernandez’s study, however it is an interesting fact how some financiers in Slovenia think.
ERP must be used in accordance with the risk-free rate of return. If we use the spot yield of government bonds, it is necessary to use the current ERP data, and vice versa. In the case of using the period average, it makes sense to match the analysis period in both risk-free rate of return calculation and the ERP calculation.
I tend to use the KPMG study, as it is based on European indices, and is of more relevance for domestic companies’ calculations. Also, using a methodology that predicts future cash flows, KPMG’s method is future-oriented.
For further discussion on the use of different parameters in business valuation, you can write to me on Linkedin.


We are an ideal partner to entities with a long-term business success vision, who want to conquer challenges and prosper.
Contact us